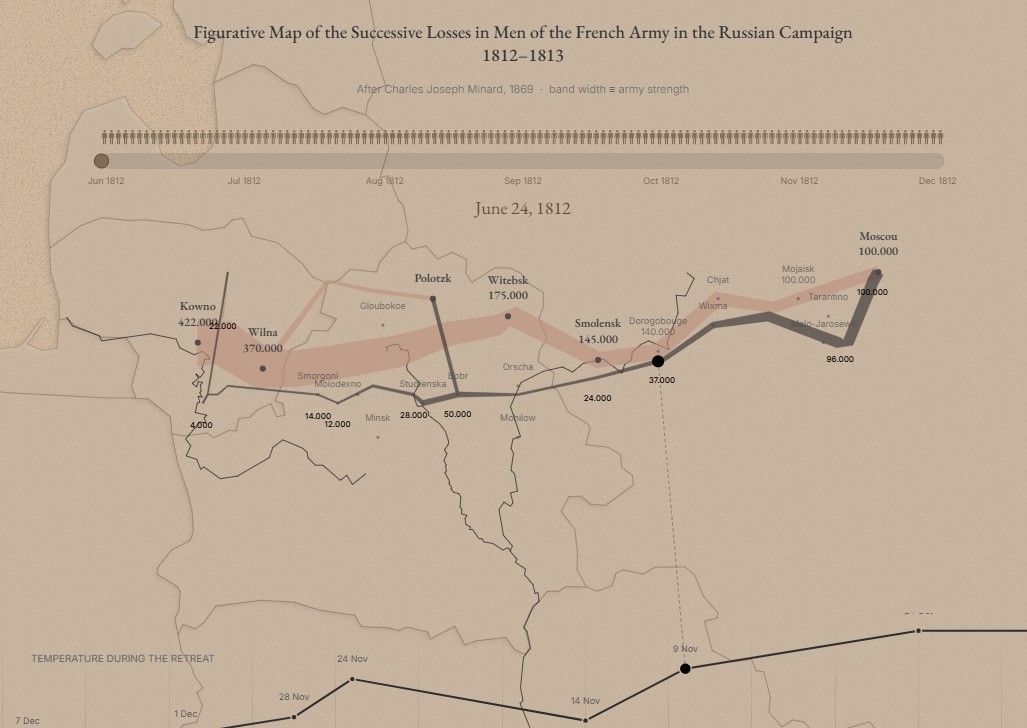
Napoleon's March to Moscow
A take on Minard's legendary 1869 infographic. Watch the Grande Armée march to Moscow and back, with troop numbers, temperatures, and geography all playing out on one map.
Explore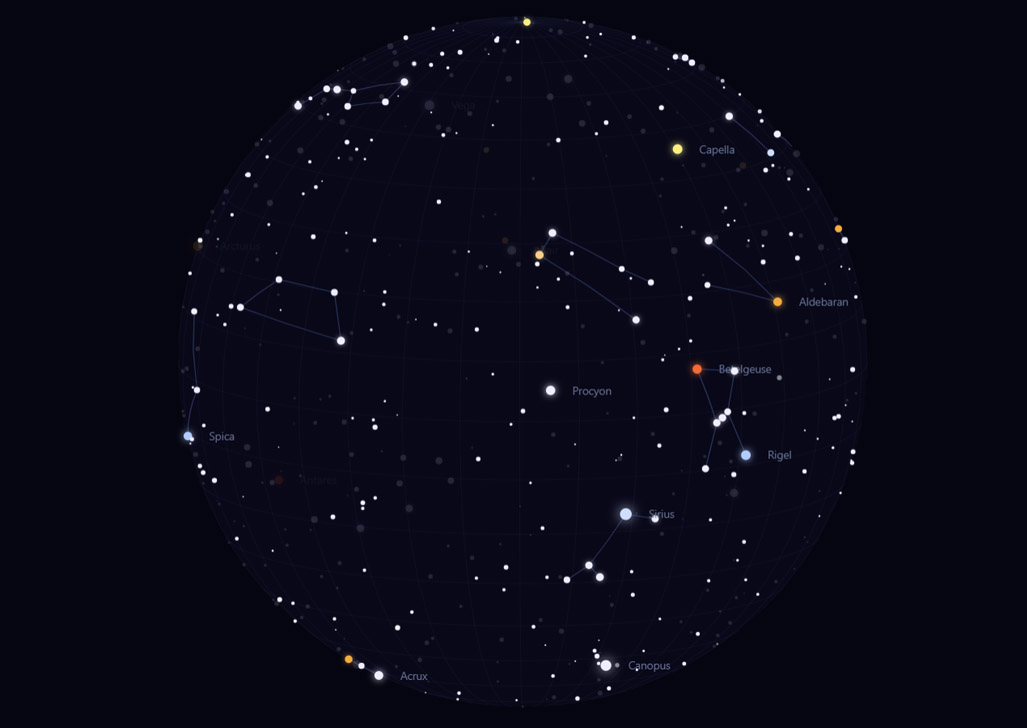
Celestial Sphere
Spin a star globe, pick a constellation from the dropdown, and watch it fly into view. Stars twinkle, dim behind the horizon, and constellation lines light up on hover. A little planetarium in your browser.
Explore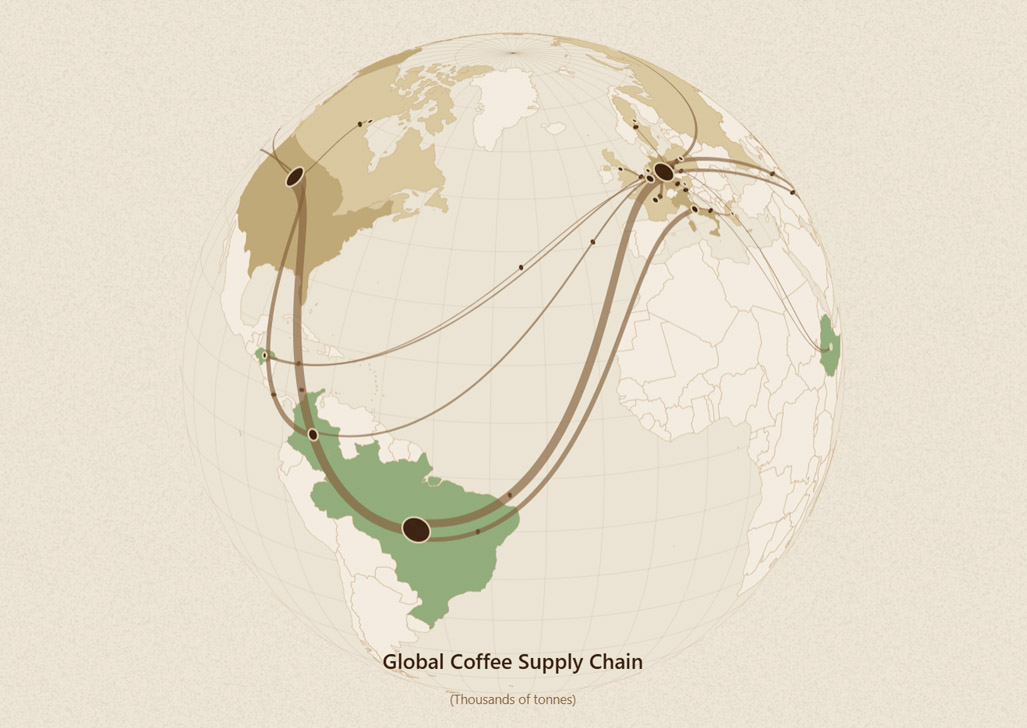
Coffee Supply Chain
Follow coffee beans on their journey from farms in Brazil and Ethiopia through European hubs to your cup. Tiny animated beans drift along the Sankey flows on a slowly spinning globe.
Explore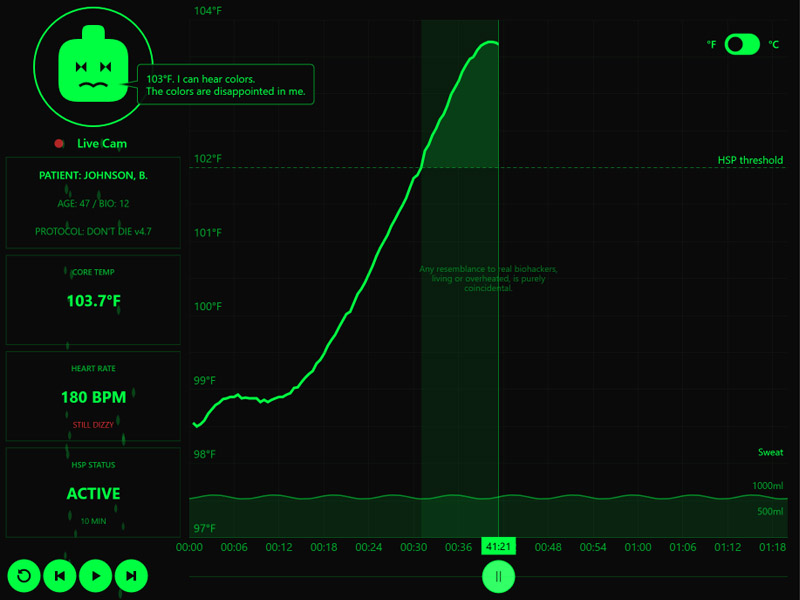
Sauna Session Biometrics
Watch core temperature, heart rate, and sweat output evolve through a 60-minute sauna session. Hit play and see heat shock protocol thresholds light up in real time.
Explore